Selling on Amazon in 2025 looks easier than ever—until you try to figure out how much you’re actually making.
Your sales look great. But when the payouts arrive, it doesn’t add up.
Where’s all the money going?
It’s the silent killer for new and growing Amazon sellers: misunderstanding your real profit after fees, PPC, and hidden costs. If you’ve ever caught yourself wondering, “Am I even making money after all these expenses?”—you’re not alone.
In this blog, we’ll walk you through exactly how to calculate your true profit on Amazon, uncover the most overlooked expenses, and share the tools top sellers use to stay ahead.
Quick Guide: What We’ll Answer
Why “Profit” on Amazon Isn’t Always What It Seems
Let’s say you’re selling a product for $29.99.
You might assume the math is simple:
Sale Price – Product Cost – Amazon Fee = Profit
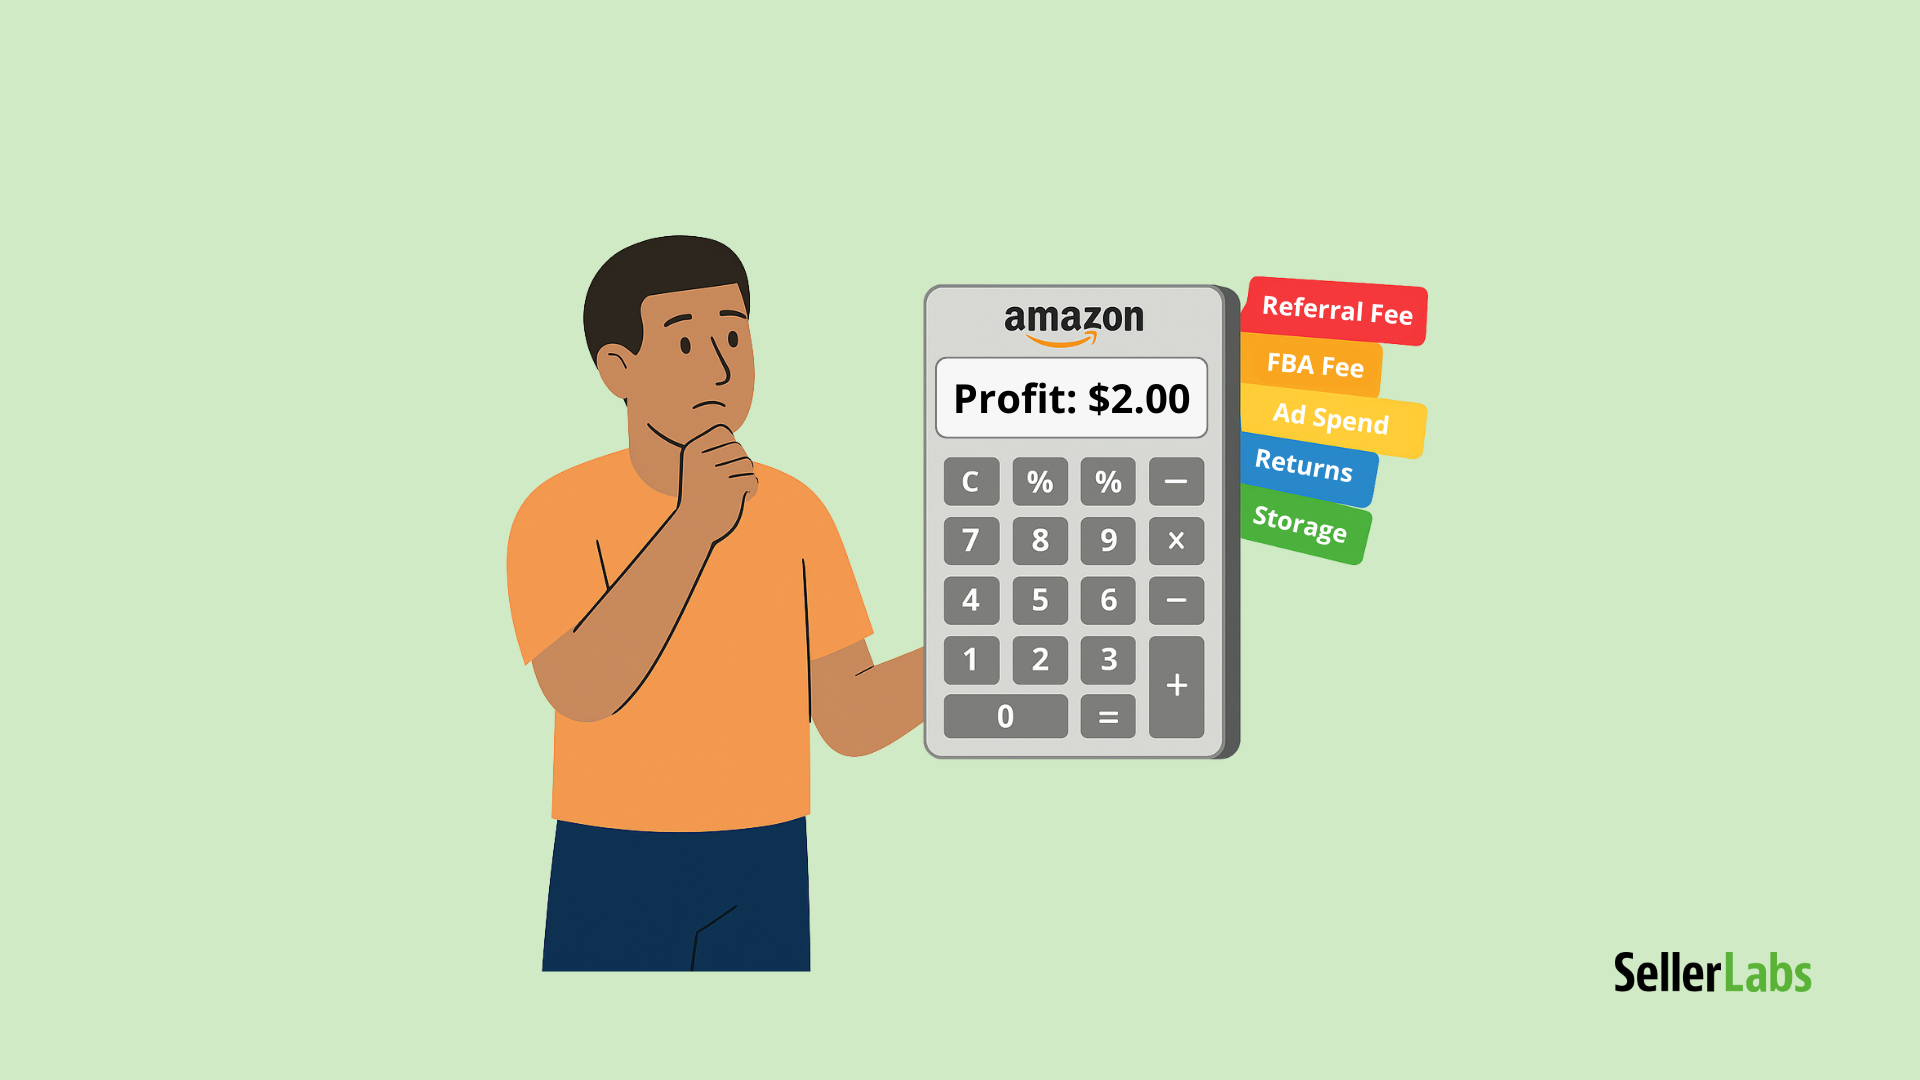
But in reality, you’re also paying for:
- Referral fees (usually 8–15%)
- FBA fulfillment fees
- Storage fees
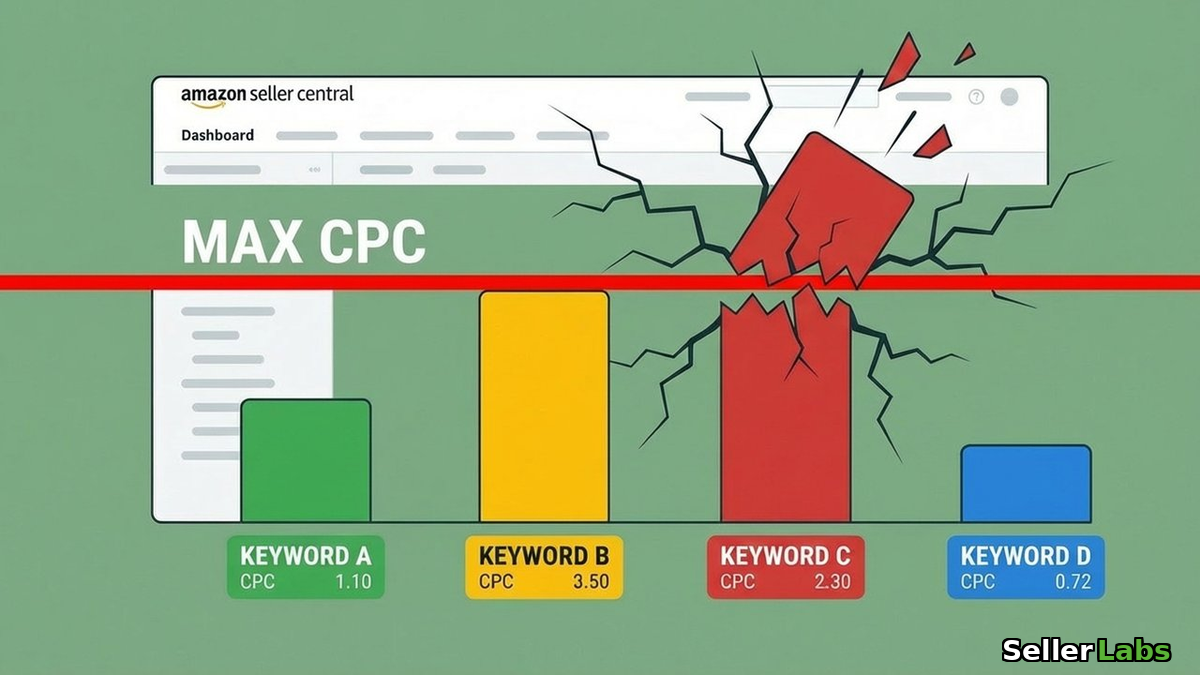
- PPC ad spend
- Shipping to Amazon
- Returns/refunds
- Promotions or coupons
- Miscellaneous fees (like high-volume listing or storage surcharges)
And suddenly, that $10 “profit” is down to $2—or worse, a loss.
That’s why tracking true profitability is the single most important step for scaling on Amazon.
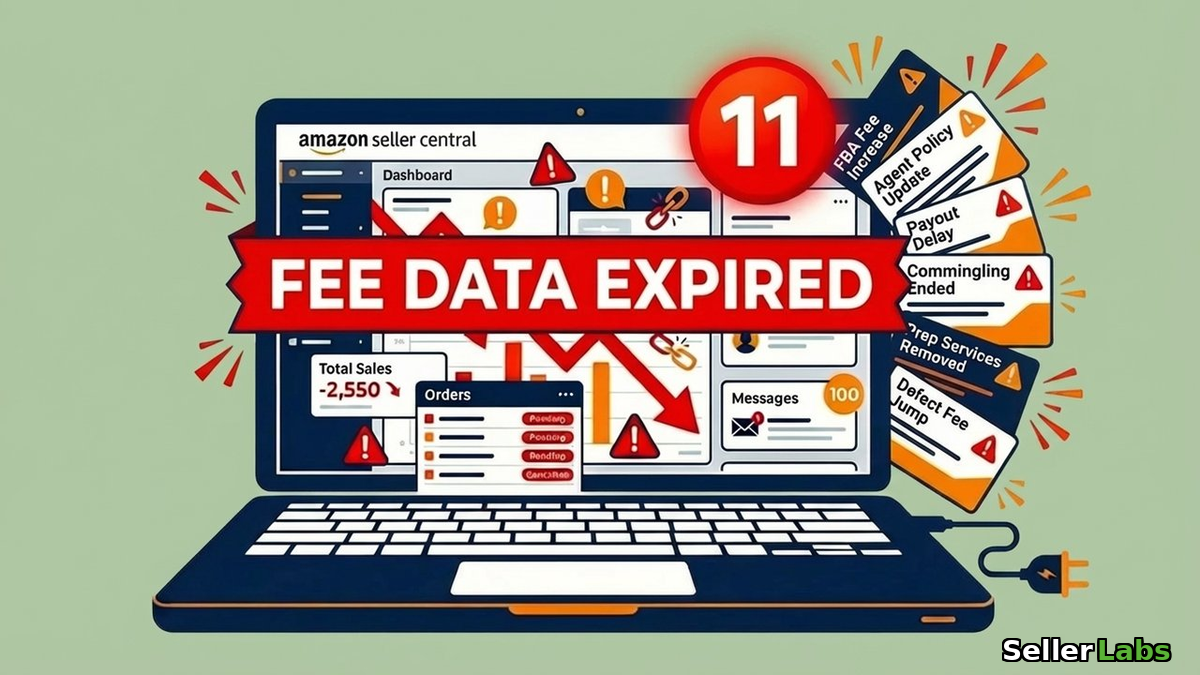
What Are the Real Amazon Fees in 2025?
Amazon’s fee structure has gotten more complex this year, especially with:
✅ FBA fee increases in January 2025
✅ New low-inventory surcharges
✅ Returns processing adjustments
✅ Inbound placement service charges
Here’s a simplified breakdown of the core fees to account for:
| Fee Type | What It Is |
|---|---|
| Referral Fee | 8–15% of the sale price, depending on the category |
| FBA Fulfillment Fee | Flat fee based on weight/dimensions (e.g., $3.22 per unit avg.) |
| Storage Fees | Monthly and long-term based on volume |
| Returns Processing Fee | Applied on certain returned items |
| Promotions & Coupons | Percent or dollar discount + redemption fees |
💡 Tip: Don’t rely on generic calculators. Fees vary by category, size tier, and time of year.
How to Calculate Your Amazon Profit After PPC
Step 1: Get Your Total Revenue
Use your gross sales revenue before refunds or promos.
Step 2: Subtract All Amazon Fees
This includes:
- Referral fees
- FBA fees
- Storage fees
- Return fees
- Promotional discounts
Step 3: Subtract Product Cost (COGS)
Include landed costs, shipping to FBA, and prep.
Step 4: Subtract Ad Spend
Use your exact PPC cost per ASIN (not just total campaign spend).
🔍 Example:
Sale Price: $29.99
COGS: $7.50
Amazon Fees: $10.50
Ad Spend: $5.00
Real Profit: $6.99 (23%)
But here’s the catch: Most sellers never track PPC cost per ASIN. That’s where profitability tanks.
Most Common Profit-Killing Mistakes (And How to Avoid Them)
❌ Mistake #1: Only Tracking Top-Line Revenue
You feel like you’re winning—but you’re bleeding profit from unseen fees.
✅ Fix: Use real-time SKU-level tracking (Tools like Profit Genius automate this.)
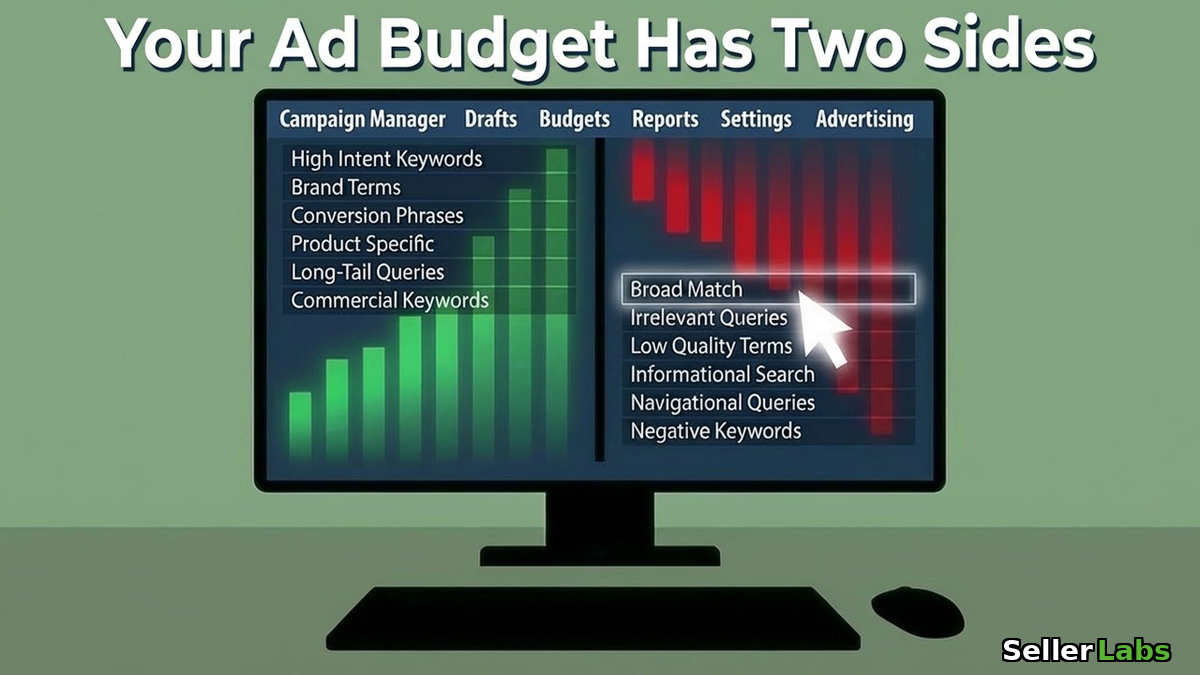
❌ Mistake #2: Ignoring Ad Spend by Product
You overspend on high-ACoS keywords and never see the impact on margins.
✅ Fix: Connect ad data directly to product profitability. See which ASINs can’t handle the cost.
❌ Mistake #3: Forgetting Refunds & Returns
Returned items still cost fees—and if you’re not factoring them in, you’re missing the full picture.
✅ Fix: Audit your return rate by ASIN and adjust restock plans or listings accordingly.
Real Talk: Manual Spreadsheets Aren’t Scalable
You can DIY it for a few SKUs, but once you’re managing multiple products, ad campaigns, and suppliers—you need automation.
That’s where Seller Labs’ Profit Genius becomes your competitive edge.
Why Sellers Use Profit Genius
Seller Labs Profit Genius is designed to give Amazon sellers the clarity they need to track and improve profitability—at the SKU level and in real time. Instead of relying on spreadsheets or guesswork, you get data-backed insights to guide smarter decisions across your catalog.
🔍 Key Features:
- SKU-Level Profitability Tracking
- Integrated Amazon Ad Spend Per ASIN
- Real-time margin and cost visibility
- Customizable COGS Inputs (shipping, prep, etc.)
💡 What You’ll Gain:
- Clear visibility into what’s really making you money
- The power to make smarter PPC, pricing, and inventory decisions
- Protection against death-by-fees or invisible overspending
📌 No more guessing. No more spreadsheets.
👉 Start your free trial of the Seller Labs Genius Bundle and see your real profit—before it disappears.
FAQs: What Sellers Are Asking About Profitability
Use a tool like Profit Genius that connects directly to Seller Central and your ad campaigns. Manual spreadsheets miss too much.
Not really. Amazon shows “Estimated Profit” but excludes things like ad spend and post-sale fees.
Track COGS, fees, and PPC per unit. If your margin is under 20%, you’re at risk—especially with high return rates or storage costs.
Yes. You can reduce ad waste, optimize fulfillment fees, lower returns, and even switch to FBM on high-fee items.
Final Thoughts: Know Your Numbers or Lose Your Margin
In 2025, data is the difference between 6 figures in sales and 6 figures in profit.The sellers who succeed aren’t always the biggest—they’re the ones who understand their numbers better and act faster.
See your real profit per SKU with SKU Economics in Profit Genius
Stop guessing. Start knowing.
👉 Try Profit Genius inside the Seller Labs Genius Bundle—free for 30 days.