Sales on an ASIN drop, and you do what experienced sellers do. You open Campaign Manager, raise the budget on the campaigns feeding that product, and maybe bump bids on your best exact-match keywords. More traffic, more sales. It usually works, which is why you trust it.
It works only when traffic was the problem. Your sales figure is three numbers multiplied together, and a bigger ad budget fixes just one of them. If conversion fell, extra budget buys more visitors into a page that has stopped converting them. You pay more for the same leak.
The one calculation: split the drop into traffic, conversion and price
Sales = sessions × conversion rate × average selling price. Break last month’s change into the part each factor caused, in dollars. Then pull the lever that matches the biggest number.
- Traffic effect = (this month’s sessions − last month’s sessions) × last month’s conversion rate × last month’s price
- Conversion effect = this month’s sessions × (this month’s conversion rate − last month’s conversion rate) × last month’s price
- Price effect = this month’s units × (this month’s price − last month’s price)
The three effects add up exactly to the total change. No residual, no rounding bucket. That property is what lets you trust the split.
A worked example: the budget increase that would have failed
Illustrative example
Take one ASIN selling at $30.
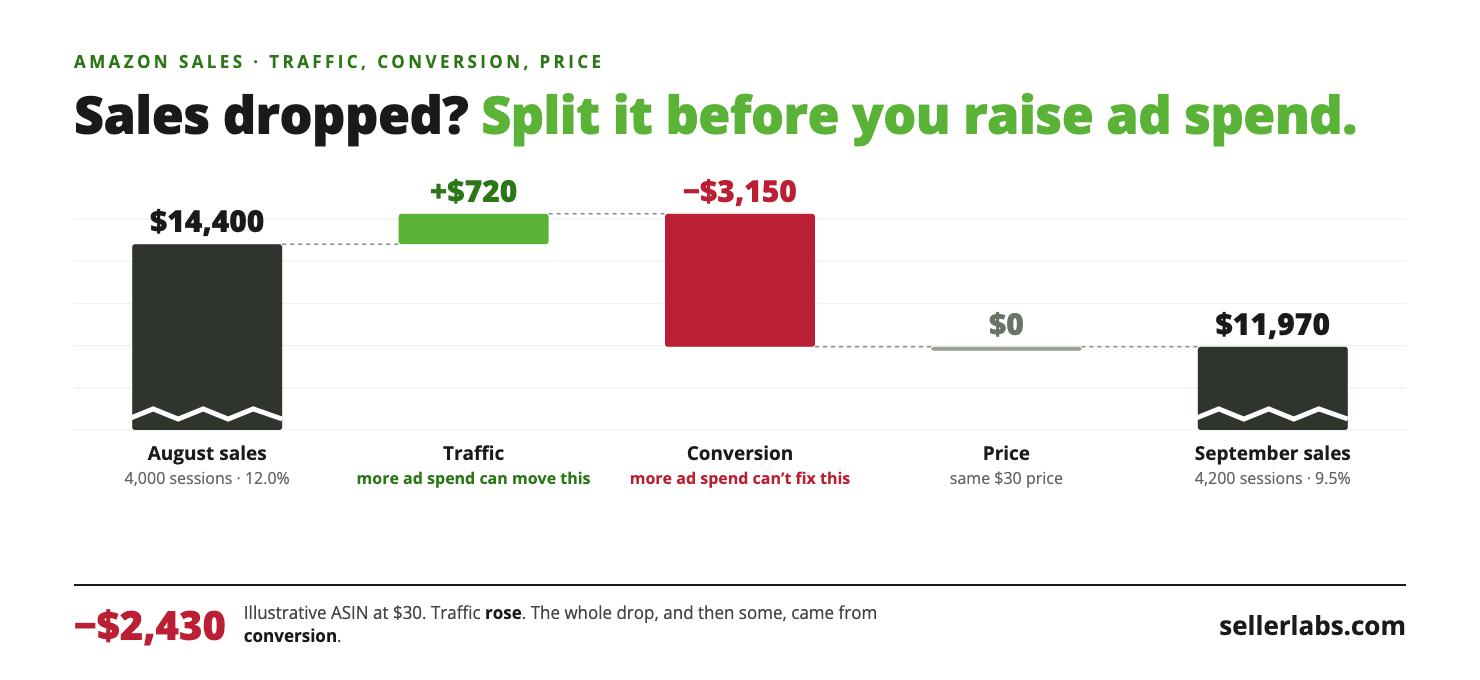
In August it had 4,000 sessions and converted at 12.0%. That is 4,000 × 0.12 = 480 units, and 480 × $30 = $14,400 in sales.
In September it had 4,200 sessions and converted at 9.5%. That is 4,200 × 0.095 = 399 units, and 399 × $30 = $11,970.
Sales fell $2,430, or 16.9%. Now split it:
- Traffic effect: (4,200 − 4,000) × 0.12 × $30 = 200 × $3.60 = +$720
- Conversion effect: 4,200 × (0.095 − 0.12) × $30 = 4,200 × −0.025 × $30 = −$3,150
- Price effect: 399 × ($30 − $30) = $0
$720 − $3,150 + $0 = −$2,430. It reconciles.
Traffic went up. It added $720. The whole drop, and then some, came from conversion.
Now run the instinct. You add $1,000 a month in ad spend at a $1.25 cost per click. That buys 800 clicks. Treat each click as one session, landing on a page that now converts at 9.5%: 800 × 0.095 = 76 units, and 76 × $30 = $2,280 in sales. You get most of the way back, at a 43.9% ACoS on the new spend, before product cost. Over a quarter that is $3,000 in ad spend to recover what you already had. And that assumes the new clicks convert as well as the page average. Extra ad traffic can convert worse, because the added clicks tend to come from lower-intent searches.
Fix the conversion instead. If the page gets back to 12.0% on the same 4,200 sessions, that is 4,200 × 0.12 = 504 units, or $15,120. That is $3,150 a month above September with no added spend.
Same ASIN, same month, two decisions. The report you already look at, total sales, cannot tell them apart.
The diagnosis table
Once you know which effect is largest, this table tells you where to look. Keep it next to the report.
| Largest effect | What it usually means | Check first | Lever |
|---|---|---|---|
| Traffic, negative | Fewer shoppers reaching the page: rank slipped, a campaign ran out of budget, a keyword lost impression share, or seasonality | Campaign Manager: budget-capped campaigns and impression trends on your top keywords. Compare the same month last year before you act. | Budget and bids, or organic rank work |
| Conversion, negative, Buy Box % flat | The page stopped persuading: new negative review, star rating dipped, a competitor undercut you, main image or coupon changed, suppressed A+ content | Latest reviews and star rating; competitor prices on page one; any listing edits in the window | Listing, reviews, coupon, price position. Not ad budget. |
| Conversion, negative, Buy Box % down | Shoppers arrive and the offer is not yours or not there: lost Featured Offer, stockout, or a hijacker | The Featured Offer (Buy Box) percentage column, inventory days of supply, the offer listing | Inventory, price, account health |
| Conversion, negative, ad traffic grew | The traffic mix changed, not the page. Broad or auto campaigns are sending lower-intent shoppers. | Search Term Report: orders ÷ clicks by search term, compared with last month | Negatives and bid-downs, not listing changes |
| Price, negative | You or a promotion lowered the selling price: coupon, Lightning Deal, Subscribe & Save mix, or a repricer | Promotions and coupon history for the window | Decide whether the volume the discount bought was worth the margin |
Row four is the trap. It looks like a conversion problem, and you will want to rewrite the listing. Do not touch the listing until you have ruled it out.
Same September, different cause
Business Reports split sessions by device, not by source. Your Advertised product report gives you clicks and units for the advertised ASIN. Subtract those from the Business Report totals and you get a rough organic line. Use the advertised-ASIN units, not total attributed orders, which can include purchases of other products. The line stays rough, because a click is not a session one-for-one. It is still enough to see which half of the traffic moved.
Illustrative example
Go back to the ASIN from the worked example. Suppose August’s 4,000 sessions were 1,000 ad clicks that produced 90 units (9.0%) plus 3,000 organic sessions that produced 390 units (13.0%). 90 + 390 = 480 units. It matches.
In September you moved your main campaign’s keywords from exact to broad match and raised its budget. Ad clicks rose to 1,400 but produced only 35 units: 1,400 × 0.025 = 35, a 2.5% rate. Organic slipped to 2,800 sessions, still converting at 13.0%: 2,800 × 0.13 = 364 units. 35 + 364 = 399. Same September total as before.
The page converts organic shoppers exactly as well as it did in August. Nothing on the listing broke. At $1.25 a click, September’s 1,400 ad clicks cost $1,750 and returned 35 × $30 = $1,050 in sales, a 166.7% ACoS across all ad traffic. The fix is negatives and bid-downs on the broad terms, or a move back to exact. A listing rewrite would change something that is working.
Both stories produce the same Business Report. Only the ad report tells them apart. Pull it before you edit anything.
Where to get your own numbers
Everything comes from one report you already have.
Seller Central → Reports → Business Reports → By ASIN → Detail Page Sales and Traffic by Child Item.
- Set the date range to last month. Download the CSV.
- Set it to the month before. Download again.
- From each file take four columns per child ASIN: Sessions – Total, Units Ordered, Ordered Product Sales, and Featured Offer (Buy Box) Percentage.
- Compute conversion rate yourself as Units Ordered ÷ Sessions – Total. Compute average price as Ordered Product Sales ÷ Units Ordered.
- Put the three formulas above into three columns. Sort by the conversion effect, most negative first.
For the traffic-mix check in row four of the table: Campaign Manager → Measurement & Reporting → Sponsored ads reports → Create report → Report type: Search term.
Use child ASINs, not the parent view. A parent row blends variations that can move in opposite directions and cancel each other out.
If you would rather ask than download, the MCP section below runs the same split from a prompt.
Which ASINs to check first
Do not audit the catalog. Sort by dollars, not by percentage.
Illustrative example
With sessions flat, a 40% relative conversion drop on an ASIN that sold $600 last month is a $240 problem. A 10% relative drop on a $20,000 ASIN is a $2,000 problem.
Percent-change views put the small ASIN on top. Dollar effects put the right one there.
- The five most negative conversion effects. These are money you can recover without buying traffic, and they are the ones a budget increase would hide.
- Any ASIN whose Buy Box percentage fell. Check it even if its dollar effect is small. A lost Buy Box can cost you sales before the conversion effect gets large.
- The three most negative traffic effects. These are the only candidates for more ad spend.
Skip anything where the absolute conversion change is under one percentage point and sessions are in the low hundreds. At 300 sessions, one point of conversion is 3 units. That is noise, not a trend.
When this breaks
Low-traffic ASINs. Below a few hundred sessions a month, conversion swings on single orders. Use a 60- or 90-day window, or skip the ASIN.
Averaged percentages. If you pull daily data and average the daily Unit Session Percentage, you get the wrong rate. A day with 20 sessions counts as much as a day with 2,000. Always sum units and sum sessions, then divide.
Seasonality. A November-to-December comparison can show a seasonal traffic effect. Compare against the same month last year when the season is the likely cause.
Mid-month events. If a stockout or a price change landed halfway through the month, the monthly totals blur two different states together. Split the month at the event date.
Ad clicks are not sessions one-for-one. One shopper can click an ad twice in a day and count as one session. The examples above treat them as equal to keep the arithmetic readable. In your own account, expect somewhat fewer sessions than clicks.
Several effects at once. If traffic and conversion both moved hard, the order of the formulas assigns their interaction to conversion, and any price interaction to price. That rarely changes which effect is largest. If the traffic effect and the conversion effect are close in size, work both.
How to check this with an MCP
The spreadsheet works, and for five ASINs it is quick. It is also two downloads, four columns and three formulas every month, plus a separate ad report for row four. If your Seller Labs account is connected to Claude through the Seller Labs Amazon MCP, you can ask for the same split in plain English. Seller Labs already stores the Business Report data behind it: daily sessions, units, sales and Buy Box percentage for every child ASIN, next to your Sponsored Products data.
Before you start
- The Seller Labs Amazon MCP comes with MCP Genius or the Genius Bundle. On the Claude side you need a Claude Pro plan or higher from Anthropic.
- Connect it once. In Claude, add a custom connector with the server URL
https://ignite-api.sellerlabs.com/mcp, click Connect and sign in to Seller Labs. There is no API key to copy. Full setup steps. - Wait until a few days into the new month. Traffic data can run several days behind, so early in the month the last days you are checking may be missing.
Step 1: run the split
Paste this into a new chat. Naming the table and the formulas makes it much less likely that Claude invents its own method.
Using the amazon_traffic table, compare last month with the month before for every child ASIN. Do this separately for each marketplace (venue_id); never sum across marketplaces. For each month, sum sessions, units_ordered and ordered_product_sales. Calculate conversion rate as summed units ÷ summed sessions, and average price as summed sales ÷ summed units. Do not average the daily percentages.
Split each ASIN’s sales change into three effects:
Traffic = (sessions this month − sessions last month) × last month’s conversion × last month’s price
Conversion = sessions this month × (conversion this month − conversion last month) × last month’s price
Price = units this month × (price this month − price last month)
Skip ASINs with fewer than 300 sessions in either month. List the ten most negative conversion effects in dollars. For each, show both months’ sessions, conversion rate, price, and Buy Box percentage weighted by page_views. Confirm that the three effects add up to the total change.
You get the same ranking the spreadsheet gives you, for the ten biggest problems, with the Buy Box column already beside it. That tells you whether each ASIN belongs in row two or row three of the table.
Step 2: rule out the traffic mix
Before you touch any listing on that list, check row four. Follow up in the same chat:
For the top five ASINs from that list, pull clicks and 7-day same-SKU orders (attributed_conversions_7d_same_sku) from product_ad_performance, where campaign_type is sponsoredProducts, for both months. Subtract them from the amazon_traffic sessions and units to get a rough organic line. Show ad conversion and organic conversion side by side for each month.
This is the same September, different cause test from above. If organic conversion held and ad conversion fell, the listing is fine and the problem sits in your campaigns. Same-SKU orders keep purchases of other products out of the ad line. The table counts orders, not units, so the organic line runs slightly high when an ad order has more than one unit. It stays rough for that reason, and because a click is not a session one-for-one.
Step 3: find the cause
Pick the follow-up that matches the row the ASIN landed in:
- Row two, the page stopped persuading: “Show me every review of 3 stars or fewer for this ASIN over the last 60 days, newest first.”
- Row three, Buy Box fell: “Show daily Buy Box percentage and FBA inventory for this ASIN across last month. Flag the days it was out of stock.”
- Row four, traffic mix: “For the campaigns advertising this ASIN, list search terms from last month with 20 or more clicks and no orders, with their spend.”
If row four is the answer, you can ask Claude to add the terms you choose as negative exact keywords. Ask it to show you the list before it adds anything, and check it: a negative keyword you remove later cannot be restored. Nothing in your account changes unless you tell it to.
Check the answer before you act
- The three effects must add up to the total change. If they do not, Claude used different formulas. Ask it to rerun with the ones above.
- Ask to see the query. Claude writes its own SQL. Check that it summed sessions and units before dividing, and that it grouped by child ASIN, not parent.
- Compare one ASIN with Seller Central. Pick your largest ASIN and check its sessions against the Business Report for the same dates. If they match, the underlying data is in sync. The add-up check above covers the arithmetic.
Claude does the pulling and the arithmetic. You still decide what to change on each ASIN. See plans and pricing.
Frequently Asked Questions
What is a good conversion rate on Amazon?
There is no universal number worth benchmarking against. It varies by category, price point and how much of your traffic is branded. Your own trailing 90 days is the only benchmark that tells you something changed.
Does Unit Session Percentage include ad traffic?
Yes. Business Reports sessions include visits from every source: ads, organic search and external links.
Why did my conversion rate drop when nothing changed on my listing?
Check three things outside the listing: your Buy Box percentage, your stock level in the window, and whether ad traffic grew from broad or auto campaigns. Row four of the table above covers the case that is easiest to miss.
Should I lower my price to fix a conversion drop?
Only if the table points to a competitor price change. A price cut shows up as a negative price effect on every unit you sold this month, including the extra ones the cut brought in. Run the three formulas before and after, and confirm the conversion gain outweighs it.
Related Reading
- Is Your Amazon PPC Keyword Profitable? The 60-Second Test
If the split says traffic, check that the keywords you would fund are profitable before you raise a single bid. - Is Your Repricer Even Running?
For row three of the table, when Buy Box share fell because the tool meant to protect it quietly stopped. - Amazon PPC Audit: The System That Finds and Fixes Wasted Ad Spend Every Month
For row four, a monthly pass through the Search Term Report for terms that click and never buy. - ICAP for Amazon: The 10-Minute System to Fix Impressions, Clicks & Conversions
The weekly funnel check that catches a conversion slide before it shows up in a monthly split.