New to Amazon Advertising?


On January 14, 2021, Amazon released a new report for advertisers! You can now access the Sponsored Products Impression Share Report to help you make sense of where it is best to spend your advertising dollars.
Now, there was a Sponsored Brand Impression Share Report released a few months ago. Sponsored Brands are only available to Brand Registered sellers, so this feature was a bit limited in its accessibility. With its expansion to a separate report just for Sponsored Products Ads, it’s now easier than ever to gain insight to the success of your advertising efforts.
How do I access the Sponsored Products Impression Share Report?
Note: The report is still in BETA, but we do expect it to roll out to all accounts in the near future.
You can access the report (if it’s available for your account) within the Advertising portion of your Seller Central account. Once there, navigate to “Reports” in the left-side menu. You’ll then “Create Report” using the button in the upper left.

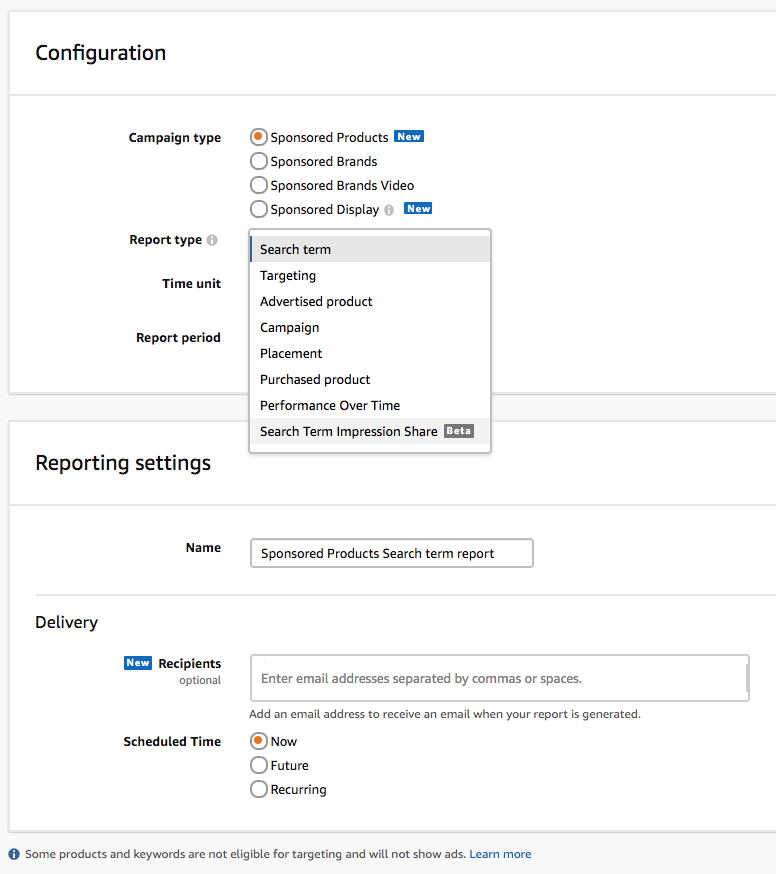
As you can see, the report is marked as BETA. In addition, you can also send this download to other members of your team with the new “Recipients” functionality. Finally, you can also set this as a recurring download, sent straight to your inbox daily, weekly, or even monthly.
Once downloaded, your report will look a little something like this (without your private information redacted):

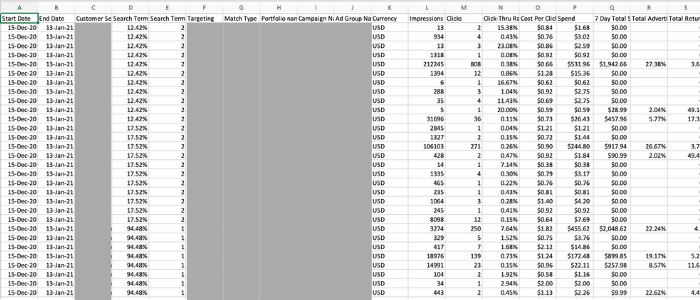
Now, let’s go over a few of the columns in the spreadsheet. Most of the columns on the right side are more familiar when it comes to Amazon Advertising: Impressions, Clicks, Spend, etc.
On the left side is where we get into the power of this report.
- Column C: Customer Search Term
- Column D: Search Term Impression Share
- Column E: Search Term Impression Rank
What can I do with this information?
That’s a great question! Keep in mind that this report is exclusively for Sponsored Product Ads. You can also use the below approach for your Sponsored Brands Search Term Impressions Report as well.
In a nutshell, the Sponsored Products Impression Share Report will tell you how much of the market you have when it comes to particular customer search terms. When combined with fields like “Sales,” it will also help you understand what is actually driving conversions. Then, add in your “Impressions” field to see what people searched for when they landed on your ad and then purchased your product.
The main goal of this report is to see where you’re already winning (high Search Term Impression Percentage and/or low Search Term Impression Rank), and where there is still room to grow. Again, this is just for Sponsored Products Ads, so a high Search Term Impression Percentage can also encourage you to try different ad types to continue growing your overall market share. For example, you should be winning the lion’s share of branded keyword impressions in as many places as you can.
There’s a lot of data in the report. When combined in different manners, you can learn a lot about your campaigns and their performance.
Did you know that our Managed Services team is usually the first to discover new features like the Sponsored Products Impression Share Report? Once they discover it, they immediately put it into use for their clients, helping them save money and advertise smarter. Get started with the Managed Services experts today!